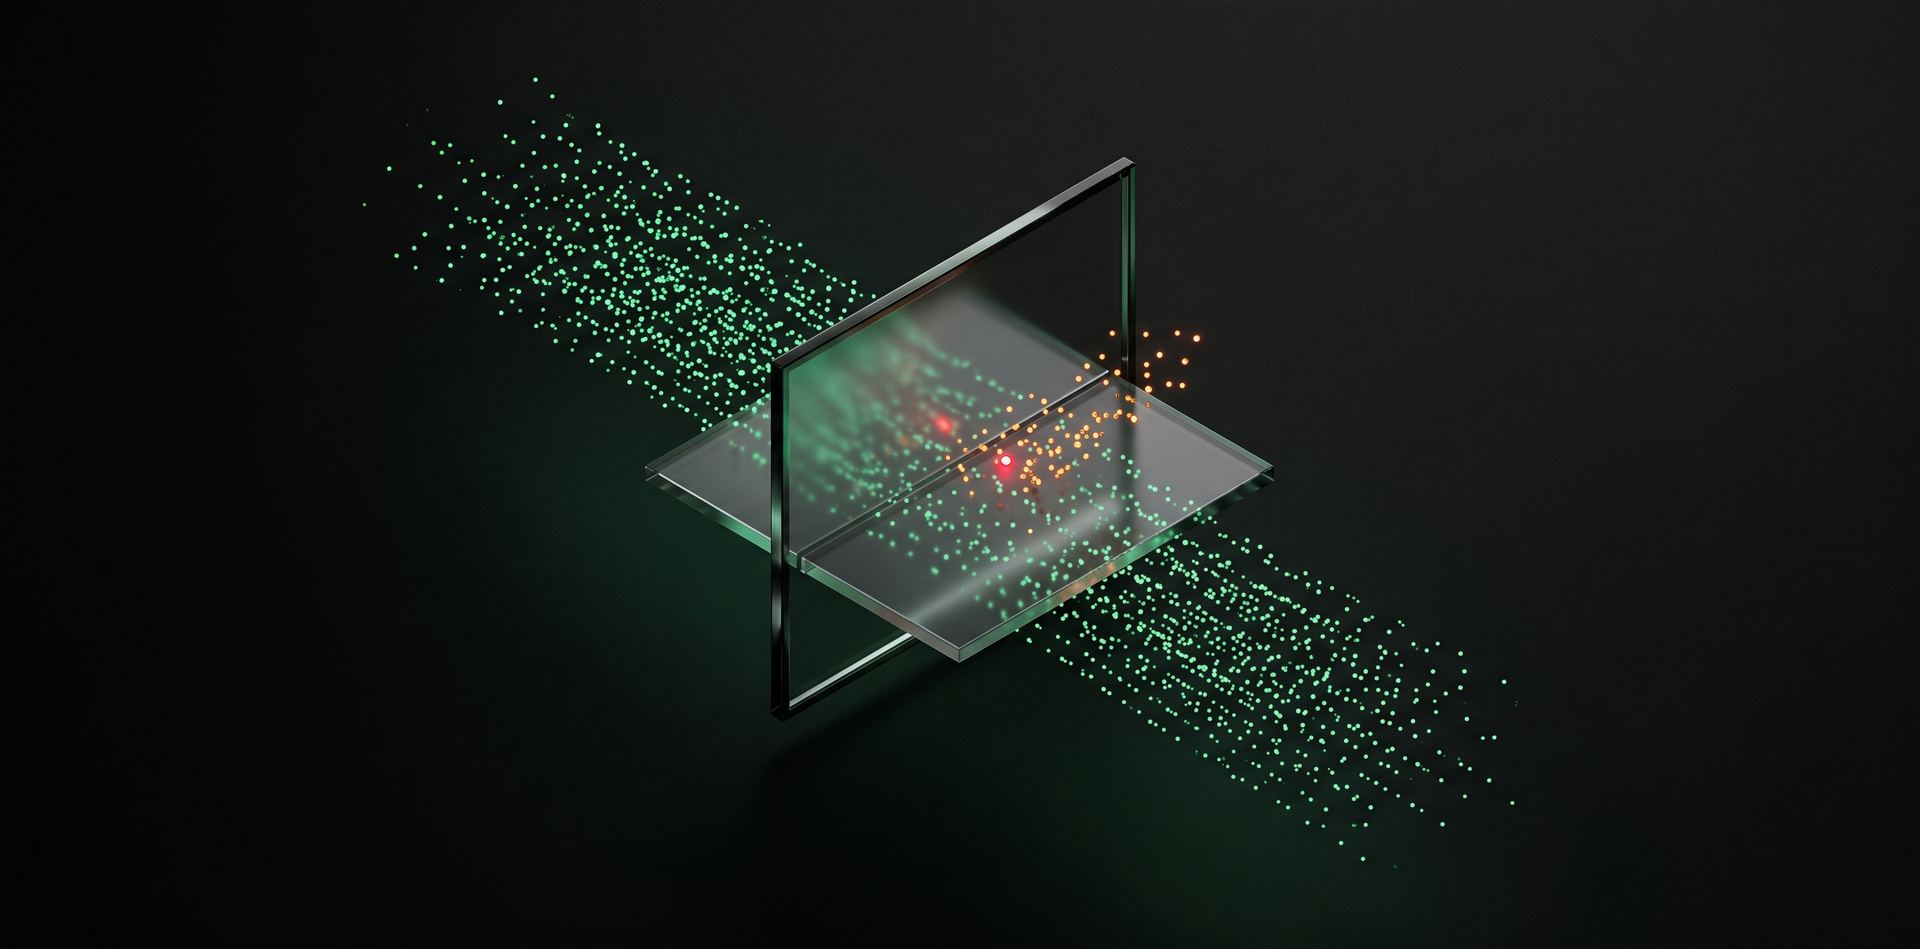
Watch what it would refuse. Then decide to enforce.

A firewall you can watch before you let it refuse anything. Bridge WAF has three modes and nothing hidden between them: off, monitor, and block. Monitor mode records what would have been refused, against your real traffic, so the decision to enforce is made with evidence rather than hope.

Included with Bridge CDN. Start in monitor: nothing is refused until you decide it should be.

Inspection does not run. Nothing is examined, nothing is recorded, and traffic reaches your origin as it otherwise would.

Requests are inspected and matches are recorded, and nothing is refused. This is the mode that answers the question every security change should start from: what would this have done to my traffic last week?

Requests that match are refused rather than forwarded, and they continue to be recorded.

Who is actually asking

Not everything that reaches your origin is a person.
Refuse them all alike and you lose the indexing you depend on. Allow them all alike and you pay for the rest.

Automation you want

Search crawlers and AI agents that read a page to represent it elsewhere. What they need is delivery, not inspection.

Not here: BotBridge serves them prerendered.

Automation you pay for

Scrapers, spam submitters, credential stuffing, an API endpoint hammered by a script. Each request looks ordinary alone; the cost is in the rate.

Answered by rate limiting per domain.

Automation aimed at you

SQL injection, cross-site scripting, path traversal, command injection. Not volume but shape: a request built to make your application do what it must not.

Answered by the three modes.


What the rules match

Named, so you can tell whether any of it is already in your traffic.
In monitor these are written down and served anyway. In block they are refused and still written down.


Web application firewall modes

A mode is the whole configuration surface.
There are three of them, they mean exactly what their names say, and there is nothing else to set.

off

Inspection does not run. Nothing is examined, nothing is recorded, and traffic reaches your origin as it otherwise would.

// no entries

monitor

Requests are inspected and matches are recorded, and nothing is refused. This is the mode that answers the question every security change should start from: what would this have done to my traffic last week?

// recorded, served anyway

block

Requests that match are refused rather than forwarded, and they continue to be recorded.

// refused, still recorded

The order matters more than the list. Turning enforcement on without having watched first means discovering the false positives from customers, which is the most expensive way available to learn what a rule does.

Configuration surface
Three modes
Rate limiting
Per domain
Flagged requests
Batched, sub-second
The cost of enforcing blind

The expensive mistake is not the attack you miss.
It is the customer you refused, who never told you.

Monitor mode turns that risk into a list you can read — against your own traffic, before a single request is refused.

Monitor refuses nothing: it records and forwards. The switch to block stays yours.


Monitor mode WAF

Monitor mode exists because a firewall's real risk is not the traffic it misses.
It is the traffic it refuses that should have been served.

Every filtering decision has two failure modes, and they are not symmetrical.

Missing an attack

Missing an attack is a problem you can usually see, measure, and respond to.

Refusing a customer

Refusing a customer is a problem that reports itself through nobody: the person leaves, assumes the site is broken, and does not come back to explain. A rule set that has never been observed against real traffic is a set of guesses about which of those you are choosing.

Running in monitor first converts that guess into a list. You see which of your own requests would have been caught, which integrations would have broken, and whether the pattern you were worried about actually appears in your traffic at all.


Edge rate limiting and evidence

Rate limiting is applied per domain, which is the unit the limits are defined and counted against.
Flagged requests appear in a security activity log close to the moment they are flagged: entries are delivered in batches, with sub-second latency.

Rate limiting per domain

This is worth stating precisely, because rate limiting is described in many different granularities elsewhere and the difference decides how you use it. Limits here belong to a domain rather than being derived from something about individual callers, so the question to answer before setting one is what volume the domain as a whole should be prepared to accept.

REFILL REQUESTS ALLOWANCE SERVED 429

The general subject, including why limits set per client behave differently from limits set elsewhere and what over-limiting costs you, is covered in the documentation on application-layer attacks.

The activity log

Two things follow from that, and the second is the more useful. The first is that monitor mode is worth running because you can actually read the result while it is still relevant, rather than reviewing yesterday. The second is what the log is for: it records requests the firewall flagged.

FLAGGED LOG ONE BATCH SUB-SECOND

It is therefore not a traffic overview, not a view of volumetric attack statistics, and not a general analytics surface. Those are different questions with different answers, and a log that tried to be all of them would be worse at the one thing this is for.


How a request is filtered

The same request, the same route.
What changes is the outcome at the filter.

CLIENT EDGE WAF ORIGIN off monitor block inspect match decide LOG

Nothing to tune

Deliberately, and it is a design position rather than an omission.

There is no numeric level to raise or lower, no aggressiveness score to trust, and no dial whose meaning is left for you to infer. The configuration is the three modes above. This makes the system less adjustable and considerably more predictable, and it removes the class of change where somebody moves a control by one step and nobody can say what that changed. What is left when it refuses somebody wrongly is finding who was refused, not a control to turn.


Scope and handoffs

Three handoffs, stated so that nobody discovers them later.

Bot and AI-agent delivery is a different layer

Serving prerendered content to crawlers and AI agents is what BotBridge does, and it is a delivery question rather than a filtering one. This page does not restate that story.

Volumetric attacks are not stopped here

Traffic that saturates a link never becomes a request, so nothing at this layer can examine it. The distinction, and what does address each family, is set out on attack layers.

L3 / L4 · SATURATES THE LINK L7 · BECOMES A REQUEST DELIVERY · PRERENDER

Caching, naming, and certificates belong elsewhere

Each is its own subject with its own failure modes, handled by the neighbouring layers of the network.

// different layer


WAF for CDN pricing

The firewall layer is included with Bridge CDN rather than sold separately,
so there is no separate plan to choose and nothing to add.

Current terms live where signup does, at Bridge CDN.


WAF questions

What people ask first.

What do the three modes do?

off runs no inspection at all. monitor inspects requests and records what matched without refusing anything. block refuses matching requests and keeps recording them. That is the entire configuration surface, so there is no fourth state and nothing to calibrate between the three.

Why start in monitor mode?

Because the expensive mistake is refusing a customer, not missing an attack. A missed attack is visible and can be answered; a refused customer leaves silently, assumes the site is broken, and does not come back to explain. Monitor mode turns that risk into a list you can read first.

What granularity does rate limiting use?

Limits are applied per domain, which is the unit they are counted against. That is worth checking against your expectations, because rate limiting is described at several different granularities elsewhere, and the granularity decides what question you should be answering when you set a limit.

How quickly do flagged requests appear?

Close to immediately. Entries are delivered in batches with sub-second latency, which is what makes monitor mode practical rather than academic: you can read the result while the traffic that produced it is still current, instead of reviewing a report about what happened yesterday.

Is the activity log a view of attack statistics?

No. It records requests the firewall flagged, which is a different question from how much traffic arrived or where it came from. Volumetric attack figures and general traffic analytics are separate surfaces, and a log attempting to serve all three would serve each of them badly.

Does this handle search crawlers and AI agents?

No, and that is deliberate. Delivering content to crawlers and AI agents is a delivery problem rather than a filtering one, and it belongs to BotBridge rather than here. Keeping the two apart is why neither has to compromise about what it treats as unwanted traffic.

Who runs this, and how to start

Bridge WAF is the filtering layer of the BotBridge network, which covers the infrastructure between a visitor and a server: naming, delivery, certificates, and traffic filtering.

Filtering is part of serving your site, so setting it up means setting up delivery. Everything starts at Bridge CDN.

No separate plan to choose. No dial to set. Watch first, enforce when the list says so.